
 Español
 English


Capacity is an important element for the exhibition industry and the resulting economic development it generates. With the “World Map of Exhibition Venues”, UFI regularly produces a global census of all exhibition venues with a minimum of 5,000 sqm of gross indoor exhibition space. Venue definition (for the purpose of this survey): any public assembly premises with a minimum of 5,000 square meters (sqm) of indoor exhibition space that hold various types of exhibitions, trade fairs or consumer/public shows on a regular basis. The premises may be purpose-built exhibition centre space or other premises including exhibition space (e.g. hotels, arenas, sport venues, and amusement fair grounds). Exhibition Space definition: the amount of gross exhibition space in the venue regularly marketed and rented/licensed/used for exhibitions, trade fairs or consumer/public shows. “Top” in the context of this report is considered as the largest venues (or the countries/regions with the most exhibition space) and bears no relation to the quality of that space. The data collection was conducted though several channels including the supporting partners and companies mentioned on the previous page and also direct information from venues.
Important remark: This new version of the report includes significant updates for several key markets compared to the previous edition, eg. for China, India, the United States and several countries in South America. The results are considered reliable and have been researched with due diligence. They cannot however be considered as fully accurate or complete and UFI or jwc cannot be held responsible for errors or any consequences arising from the use of this information. For instance, the data for several countries currently facing specific circumstances (eg. Iran, Iraq, Russia, Ukraine, Syria, Yemen, Sudan) could only be updated with great difficulty or not at all, and will need to be treated with careful reflection. In line with UFI’s mission to provide vital data to the entire industry, this report is freely available at www.ufi.org/research. It is also available at www.jwc.eu.com. For any information on this report or other UFI’s Research activities, please contact research@ufi.org or get in touch with jwc at.
Main Results Global Results
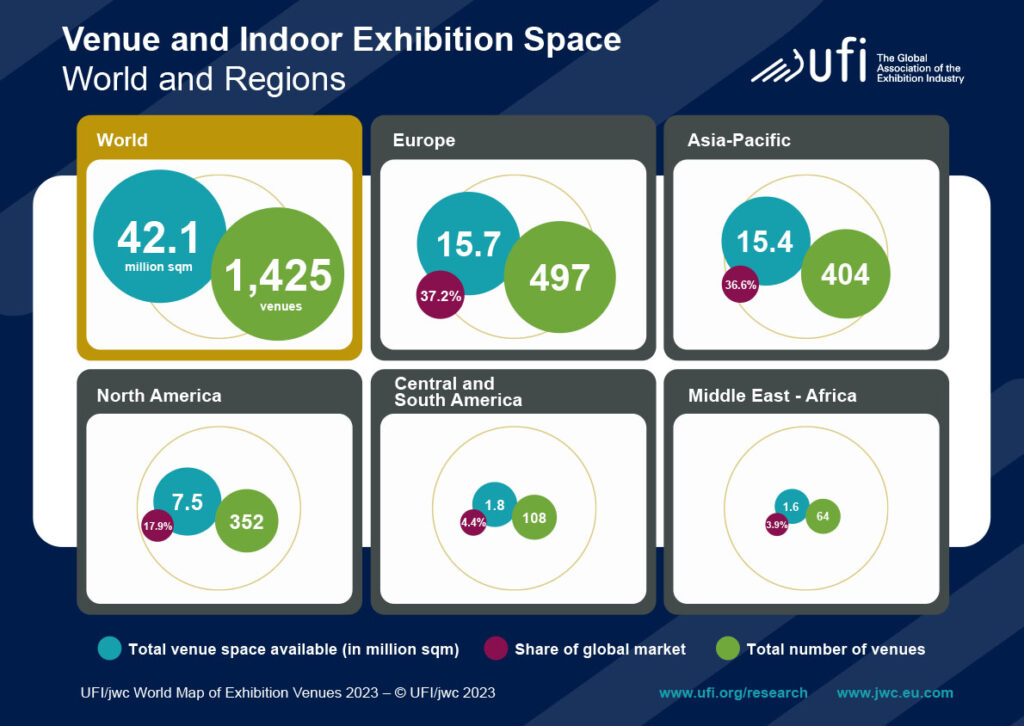
- The total indoor exhibition space worldwide reaches 42.1 million sqm for the year 2023 and 1,425 venues were identified.
- Europe is home to the most exhibition space globally (15.7 million sqm), closely followed by Asia-Pacific (15.4 million sqm). Regarding the number of venues, Europe also is home to the highest number of venues (497), followed by Asia-Pacific (404) and North America (352) respectively.
- Globally, 59% of the venues have an indoor capacity between 5,000 and 20,000 sqm. One third (35%) of all venues globally belong to the medium-size segment, offering between 20,000 and 100,000 sqm. 81 venues have more than 100,000 sqm.
- Europe is still home to most of the large venues.
- The average size of Asia-Pacific venues is bigger than in any other region.
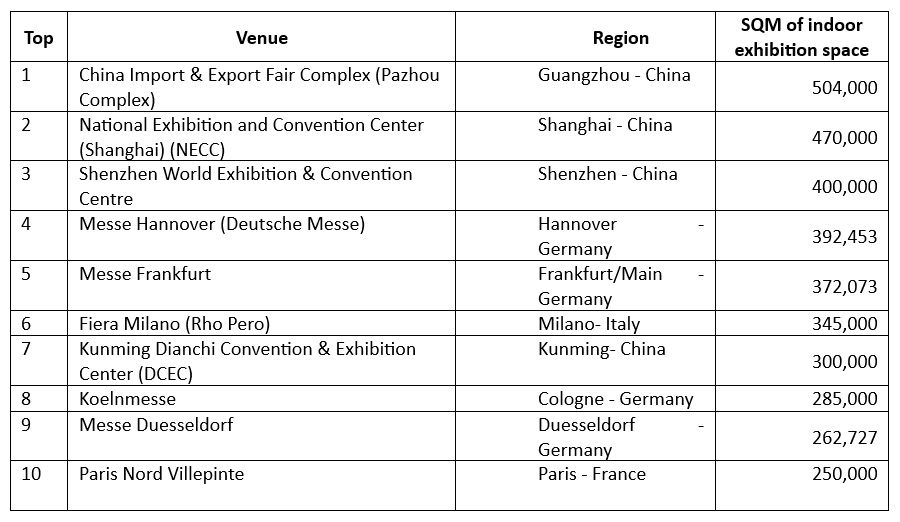
Top ten of Venues with a minimum of 100,000 sqm of indoor exhibitions space
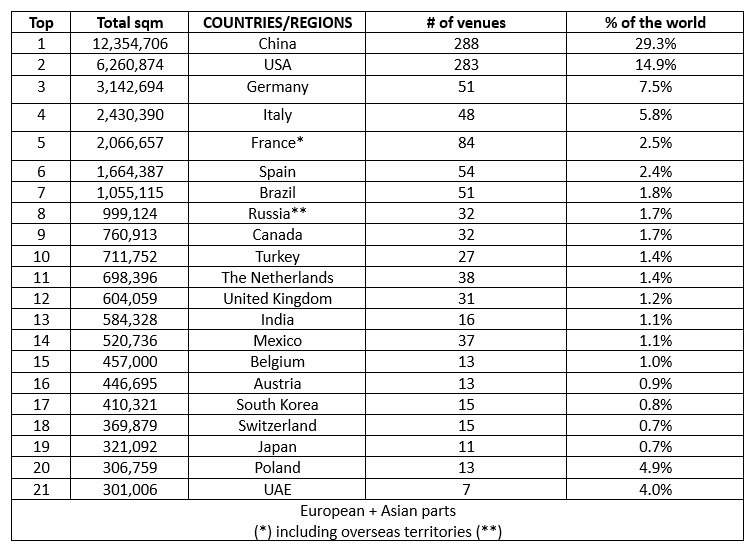
Top countries/regions Countries/regions with a minimum of 300,000 sqm of indoor exhibition space
21 countries/regions have a total indoor capacity exceeding 300,000 sqm of indoor exhibition space. The top 5 countries/regions (China, USA, Germany, Italy, and France) account for more than 62% of the total world indoor exhibition space.
Conclusion
In the second half of 2023, there are 1,425 exhibition venues with a minimum of 5,000 sqm of gross exhibition space around the world and the total global venue space is 42.1 million sqm. The number of large venues offering more than 100,000 sqm of space is 81. The Asia-Pacific region keeps closing in on Europe for available venue capacity, mainly driven by venue development in China. That being said, Europe retains a narrow lead on available venue capacities with 37.2% just about ahead of the Asia-Pacific region with 36.8%


Comments 0